Customized Reports
Tailored Reports with One Click —
Generate easy-to-read, visual reports to support your organization's decisions and
showcase
compliance.
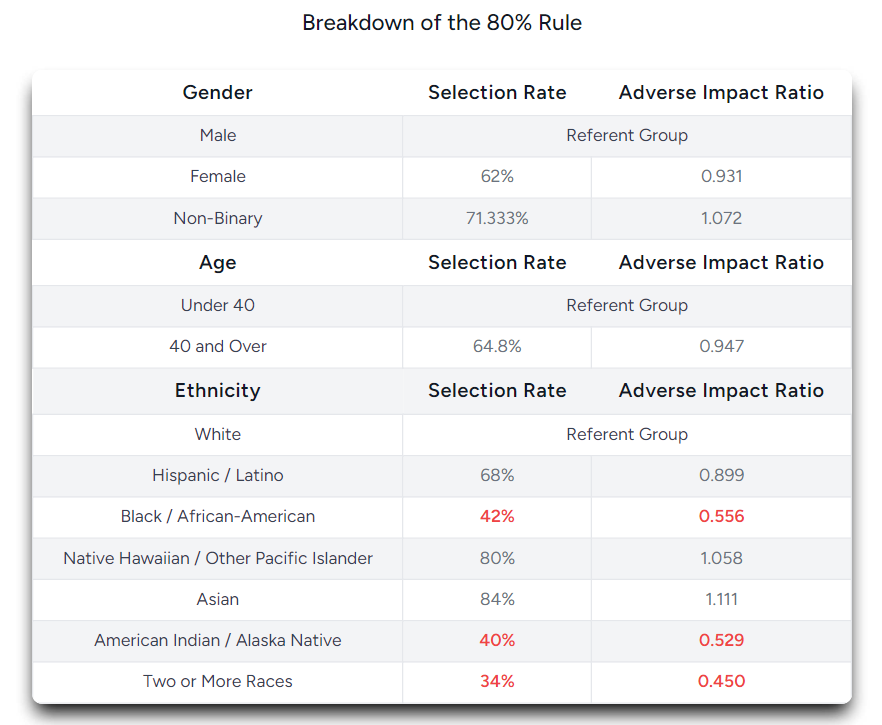
Adverse Impact Detection
Proactively Identify Disparities —
Detect and address potential biases in your hiring processes to ensure fairness and
compliance.
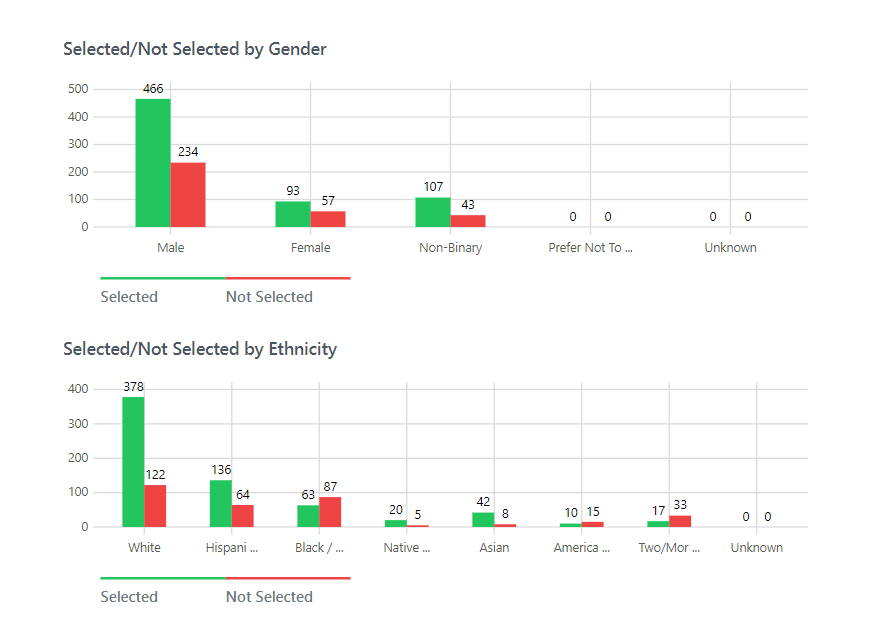
Demographic Insights
Understand Workforce Demographics —
Gain a complete view of demographic trends in your hiring practices for transparency
and diversity planning.
Streamlined Compliance
Compliance in a Few Clicks —
Simplify your organization's compliance with EEOC-related regulations, saving time
and
adding confidence to your HR processes.
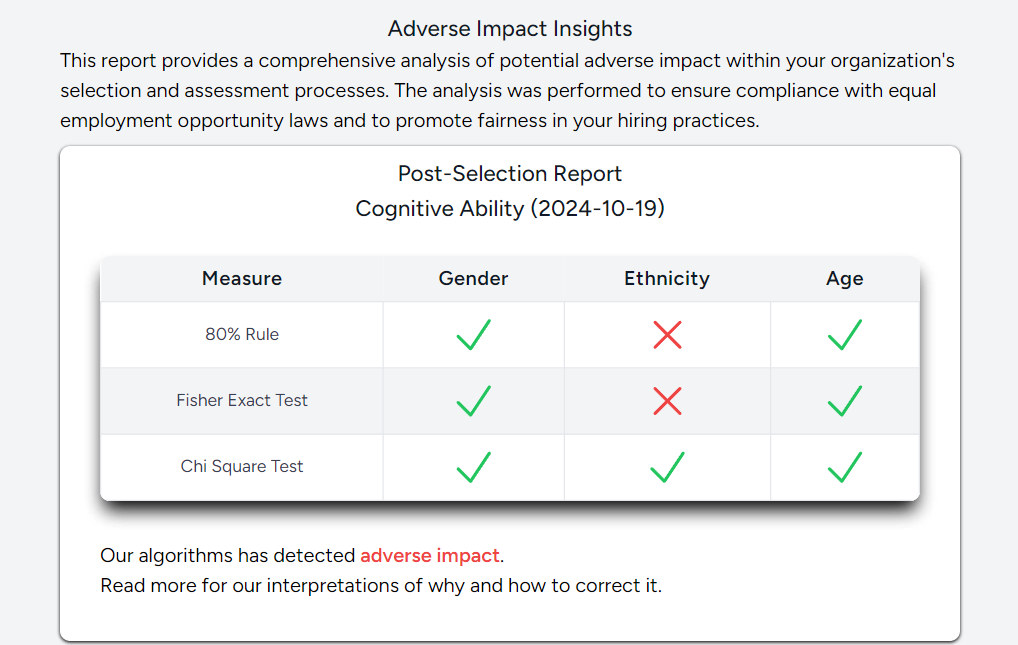
Adverse Impact Insights
This is a shortened adverse impact report generated using fully artificial data.
The goal of this report is to help you understand how an adverse impact report can help
you ensure fairness and compliance inside of your organization's hiring process. These
analyses are meant to promote fairness and compliance with equal employment opportunity
laws.
Adverse Impact Report
| Measure | Gender | Ethnicity | Age |
|---|---|---|---|
| 80% Rule | |||
| Fisher Exact Test | |||
| ANOVA | |||
| Tukey's HSD Test |
Our algorithms have detected adverse
impact.
Read more for our interpretations of why and how to correct it.
Read more for our interpretations of why and how to correct it.
| Report Criteria | |
|---|---|
| Report Type | Single Assessment |
| Assessment Type | Assessment Name |
| Oldest Assessment Date | 2026-08-02 |
| Referent Gender |
Male
|
| Referent Ethnicity |
White
|
| Referent Age |
Under 40
|
Gray Text: Indicates no significant
difference
Green Text: Indicates that the
significant difference is favorable to the protected
group. "Favorable" means that more individuals from the protected class were
selected than expected.
Red Text: Indicates a significant
difference
that negatively impacts the protected class
| Descriptive Statistics | |
|---|---|
| Total Applicants | 100 |
| Standard Deviation | 30.660 |
| Mode | 100.000 |
| Skewness | -0.157 |
| Kurtosis | -1.205 |
| Mean Score | 56.760 |
| Minimum Score | 0.000 |
| Maximum Score | 100.000 |
| Descriptive Statistics by Subgroup | |||||
|---|---|---|---|---|---|
| Gender | Total | Mean | Standard Deviation | Minimum | Maximum |
| Male | 30 | 52.200 | 28.352 | 0.000 | 100.000 |
| Female | 24 | 56.875 | 30.714 | 1.000 | 100.000 |
| Prefer Not To Answer | 19 | 62.105 | 33.395 | 5.000 | 100.000 |
| Unknown | 27 | 57.963 | 32.093 | 7.000 | 100.000 |
| Ethnicity | Total | Mean | Standard Deviation | Minimum | Maximum |
| White | 9 | 100.000 | 0.000 | 100.000 | 100.000 |
| Hispanic or Latino | 19 | 55.158 | 24.840 | 9.000 | 90.000 |
| Black or African American | 10 | 43.700 | 35.173 | 7.000 | 98.000 |
| Native Hawaiian or Other Pacific Islander | 12 | 53.250 | 29.760 | 7.000 | 100.000 |
| Asian | 8 | 56.500 | 25.014 | 12.000 | 88.000 |
| American Indian or Alaska Native | 12 | 62.917 | 32.737 | 1.000 | 99.000 |
| Two or More Races | 14 | 44.286 | 27.014 | 5.000 | 100.000 |
| Unknown | 16 | 51.563 | 30.146 | 0.000 | 100.000 |
| Age | Total | Mean | Standard Deviation | Minimum | Maximum |
| Under 40 | 36 | 52.417 | 31.846 | 5.000 | 100.000 |
| 40 and Over | 64 | 59.203 | 29.949 | 0.000 | 100.000 |
Score Histograms
Gender Histograms
Ethnicity Histograms